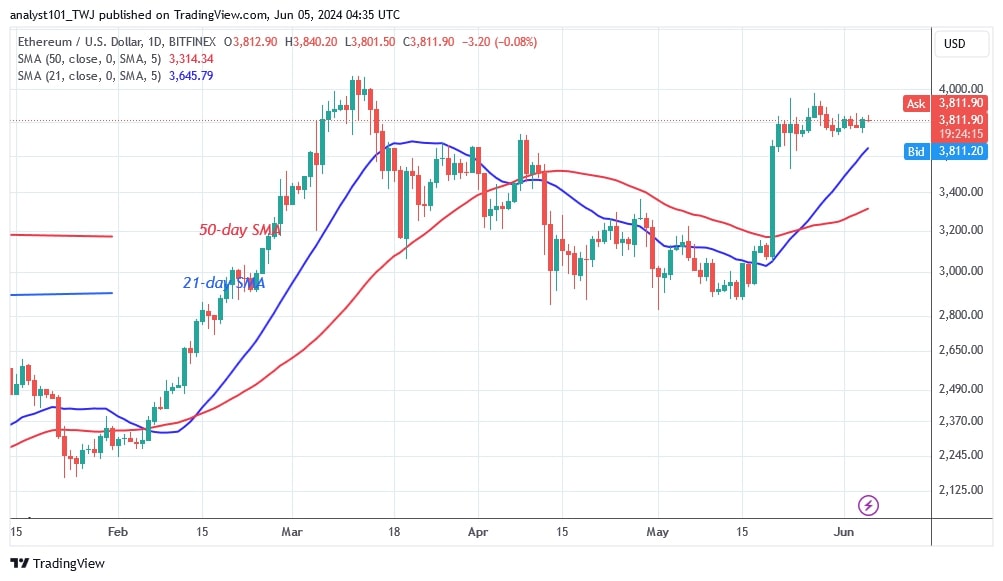
The price of Ethereum (ETH) is consolidating above the $3,730 breakout level and continues its uptrend.
Long-term analysis of the Ethereum price: bullish
Since May 21, the bulls have held above the $3,700 support but have not been able to continue the uptrend above the $4,000 high. Ether’s price behavior is dominated by doji candlesticks, which explains the reluctance of traders. The price has held steady above the support level of $3,800. A price rise above the $3,800 support level will drive the altcoin to a high of $4,200. The bullish momentum will continue to the high of $4,800.
However, if Ether fails to rally, the bears will take control. If the bears break the $3,700 or the 21-day SMA support, Ethereum will fall above the $3,300 low or the 50-day SMA support. The largest altcoin is valued at $3,811 at the time of writing.
Analysis of the Ethereum indicators
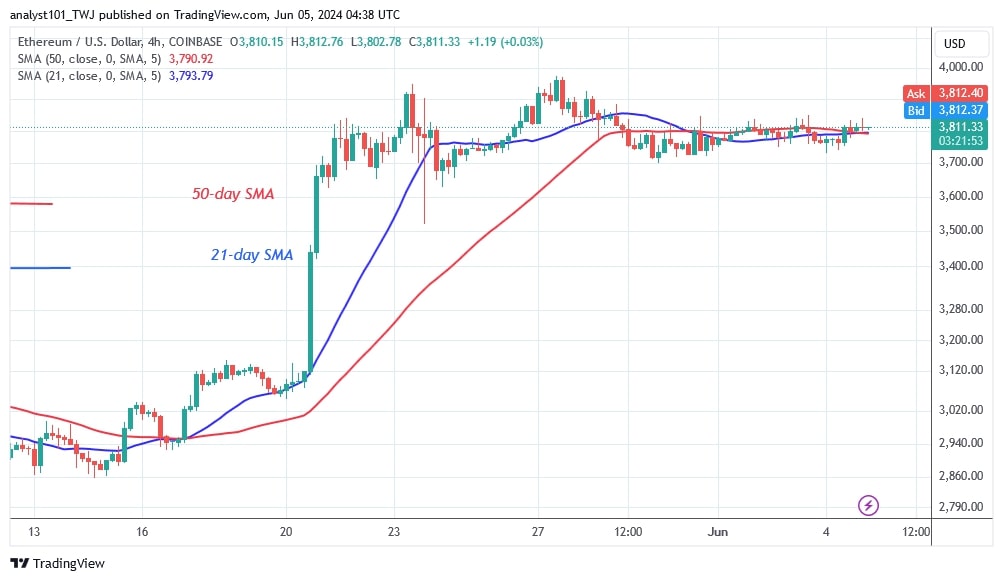
The 4-hour chart is dominated by Doji candlesticks, which have taken control of the price action. In addition, the moving average lines are horizontally flat. As Ether consolidates, the support and resistance lines are no longer recognizable. The largest altcoin is preparing for a potential rebound or breakout.
Technical indicators:
Key resistance levels – $4,000 and $4,500
Key support levels – $3,500 and $3,000

What is the next direction for Ethereum?
Ethereum is trading in a range of just under $3,700, but below $3,900. The altcoin’s price behavior is turbulent, with price movement remaining constant. Ether is easing slightly and approaching the current support level of $3,700.

Disclaimer. This analysis and forecast are the personal opinions of the author and are not a recommendation to buy or sell cryptocurrency and should not be viewed as an endorsement by CoinIdol.com. Readers should do their research before investing in funds.


