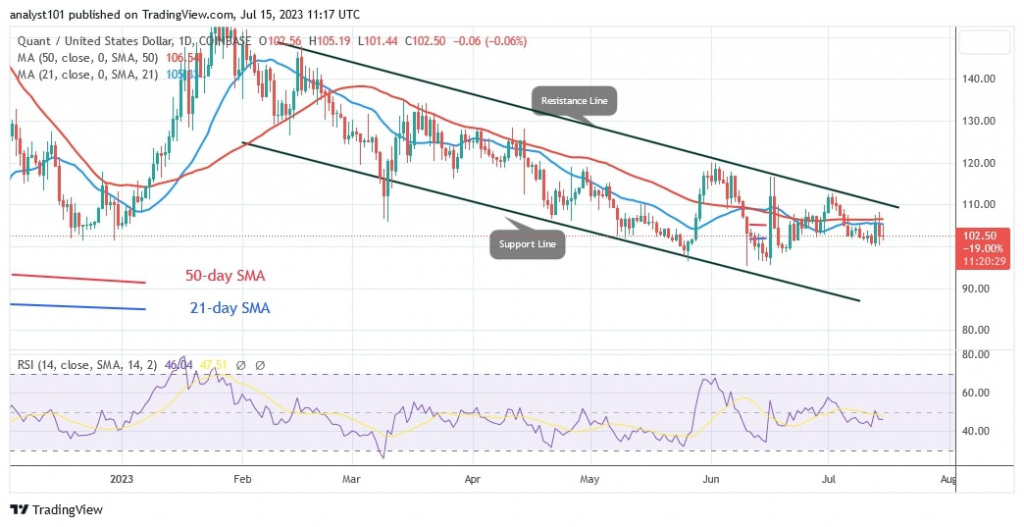
Coinidol.com reporting on the technical analysis of Quant (QNT). The price of Quant is falling below the moving average lines.
Quant (QNT) Long-Term Prediction: Declining
Since May, Quant has been trading above the $95 support level. Bears made two attempts to reapply selling pressure, which failed at the $95 support. On the other hand, buyers kept the price above the moving average but were deterred by the resistance at $110.
The barrier at $110 has slowed down the upward movement. If the current $95 support is breached, QNT will resume its downtrend. In the meantime, the cryptocurrency’s price fluctuates between $95 and $110.
Quant (QNT) Price Indicator Analysis
QNT is trading above the current Relative Strength Index period 14 support line of 45. As the price bars drop below the moving average lines, the cryptocurrency might fall. The altcoin is in a negative trend below the daily stochastic threshold of 40. The bearish momentum has slowed and flattened.
Technical Indicators:
Key supply zones: $140, $150, $160
Key demand zones: $90, $80, $70

What is the next move for Quant (QNT)?
Quant has been trading in an area above current support. Over the past two months, the bulls have defended the existing support. After being rejected at the moving average lines, the cryptocurrency is falling. The moving average lines are currently limiting the upward movement.
On July 10, 2023, Coinidol.com reported that in the past two months Quant has been trading at the bottom of the chart. The price of the altcoin was fluctuating between $95 and $120. The barrier at $120 has stopped the upward movement.

Disclaimer. This analysis and forecast are the personal opinions of the author and are not a recommendation to buy or sell cryptocurrency and should not be viewed as an endorsement by CoinIdol.com. Readers should do their own research before investing in funds.


