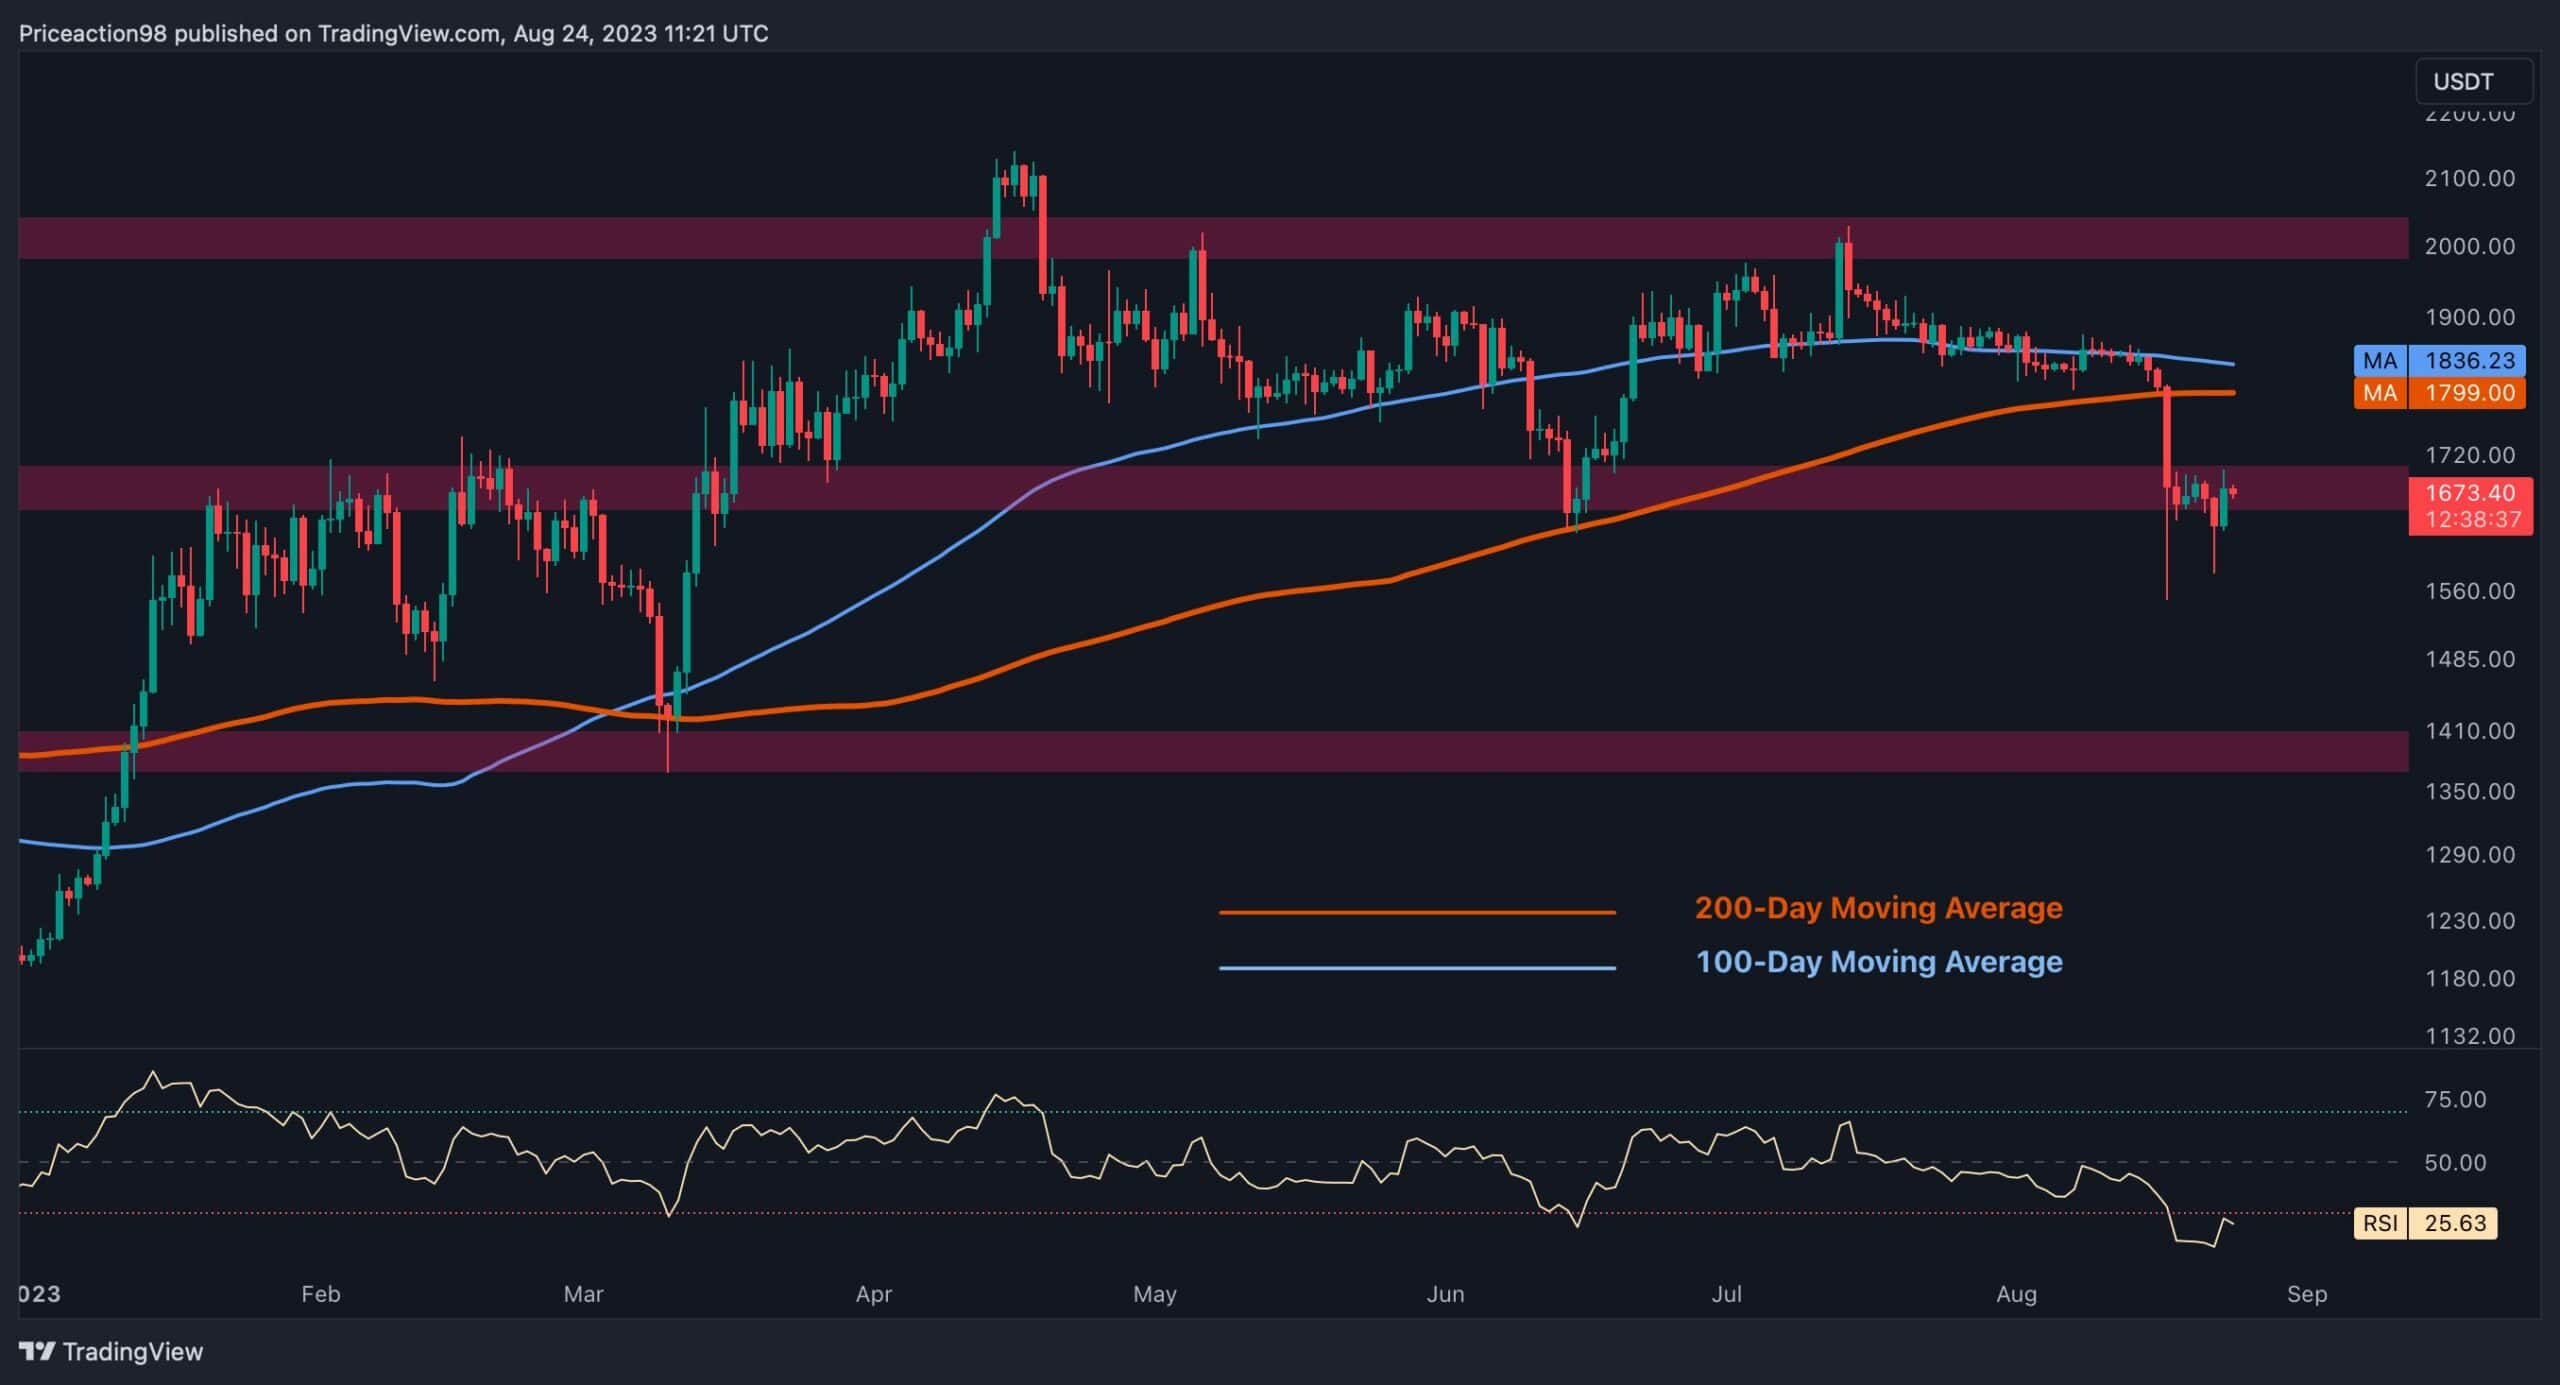
After a prolonged period of tranquil price activity near the critical level of $1.8K, there has been a significant and rapid downturn at ETH following a notable rejection. This sudden cascade has caused the price to drop below the 100-day and 200-day moving averages (MAs), indicating a bearish signal for the ETH market.
Technical Analysis
By Shayan
The Daily Chart
Looking at the daily chart, a prolonged phase of quiet price action near the $1.8K resistance level led to a sharp downward movement, breaching below the 100-day and 200-day moving averages positioned around $1,835 and $1,800, respectively. The market is typically considered to be in a bearish phase when the price resides beneath the 200-day moving average line, which is widely recognized as a pivotal trend indicator.
The short-term support at $1,650 is currently managing to hold the price, potentially setting the stage for a bullish rebound and forming a pullback. However, the recent decline has changed the market structure to mostly bearish, increasing the likelihood of a retest of the $1,400 level in the upcoming weeks.
The 4-Hour Chart
Looking at the 4-hour timeframe, it becomes evident that the price has breached the static support at $1.8K, leading to a rapid and forceful downward move. This breakdown has deepened the decline, with a prominent wick piercing through the $1,650 level.
Nevertheless, the mentioned support level has thus far effectively held the price, and the Relative Strength Index (RSI) indicator has rebounded from the oversold zone, indicating the potential for a short-term consolidation phase.
Considering the recent price action, it appears likely that a consolidation period will develop between the support at $1,650 and the resistance around $1.8K in the mid-term. This scenario is anticipated before sellers potentially make another concerted push to drive the price to lower levels.
On-chain Analysis
By Shayan
Analyzing the fund holding metric, the chart indicates a significant trend shift for Ethereum since June 2022. While Bitcoin has experienced intermittent periods of price upticks accompanied by various fund distribution zones, Ethereum has witnessed a consistent downtrend in fund holdings and distributions during this period.
Interpreting this chart, it becomes clear that there is a notable decline in the interest of asset management funds (such as ETFs and trusts) to indirectly invest in Ethereum. This contrasts with Bitcoin, where, despite fluctuations, specific periods of increased demand and fund distribution can be identified.
The consequence of this trend is a gradual reduction in the funds’ market participation, leading to diminished trading liquidity and overall interest in Ethereum. For the market to experience a sustainable price upswing, a steady rise in investment interest from these funds is crucial.
As of now, this decline in fund engagement necessitates a cautious approach, particularly when viewed in conjunction with other data points. Consistently tracking the trends of this indicator can potentially provide valuable insights into determining the future trajectory of the Ethereum market.
Binance Free $100 (Exclusive): Use this link to register and receive $100 free and 10% off fees on Binance Futures first month (terms).
PrimeXBT Special Offer: Use this link to register & enter CRYPTOPOTATO50 code to receive up to $7,000 on your deposits.
Disclaimer: Information found on CryptoPotato is those of writers quoted. It does not represent the opinions of CryptoPotato on whether to buy, sell, or hold any investments. You are advised to conduct your own research before making any investment decisions. Use provided information at your own risk. See Disclaimer for more information.
Cryptocurrency charts by TradingView.

