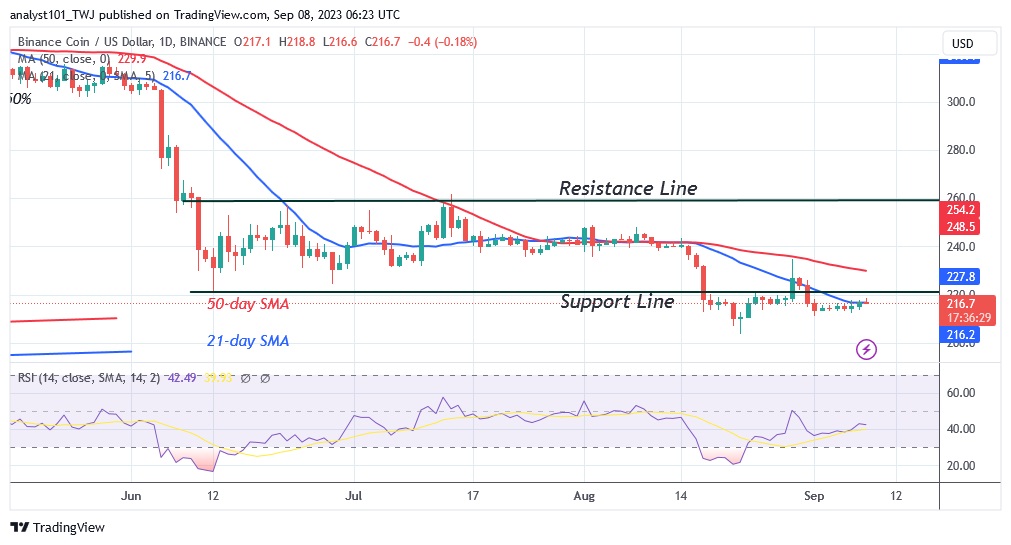
The latest price analysis by Coinidol.com report, the price of BNB has remained stable above the $210 support level.
BNB price long term forecast: bearish
The altcoin has reached a high of $218.80, but is rejected at this level. Buyers are struggling to keep the price above the $220 level. The resistance at $220 was the previous support that was broken.
The support has now become a barrier. The BNB price will rise above the moving average lines or the high at $240 if it breaks the initial barrier at $220. The uptrend will continue to the high at $260. However, if the bullish scenario is disproved, the altcoin will decline but will be forced to trade in a range between $200 and $220. Meanwhile, the altcoin is on the retreat and has reached a new high of $214.
BNB indicator display
The crypto asset is correcting upwards and approaching the level of the Relative Strength Index 42 for the period 14. The price bar is slightly above the simple moving average of the 21-day line. If the 21-day support SMA holds, BNB will rise. The altcoin has moved into an overbought region of the market. It has a negative momentum and is below the daily stochastic value of 80.

Technical Indicators:
Key resistance levels – $300, $350, $400
Key support levels – $200, $150, $100
What is the next direction for BNB/USD?
BNB has recovered but still needs to overcome the $220 resistance level. The cryptocurrency asset is on the retreat and might be forced to oscillate between the $200 and $220 price levels. If the coin overcomes the resistance at the recent high, it will regain positive momentum.
Last week Coinidol.com reported that this will be the second breakout. On the first breakout, the market fell to a low of $203, but the bulls bought the dips.
Disclaimer. This analysis and forecast are the personal opinions of the author and are not a recommendation to buy or sell cryptocurrency and should not be viewed as an endorsement by CoinIdol.com. Readers should do their research before investing in funds.


