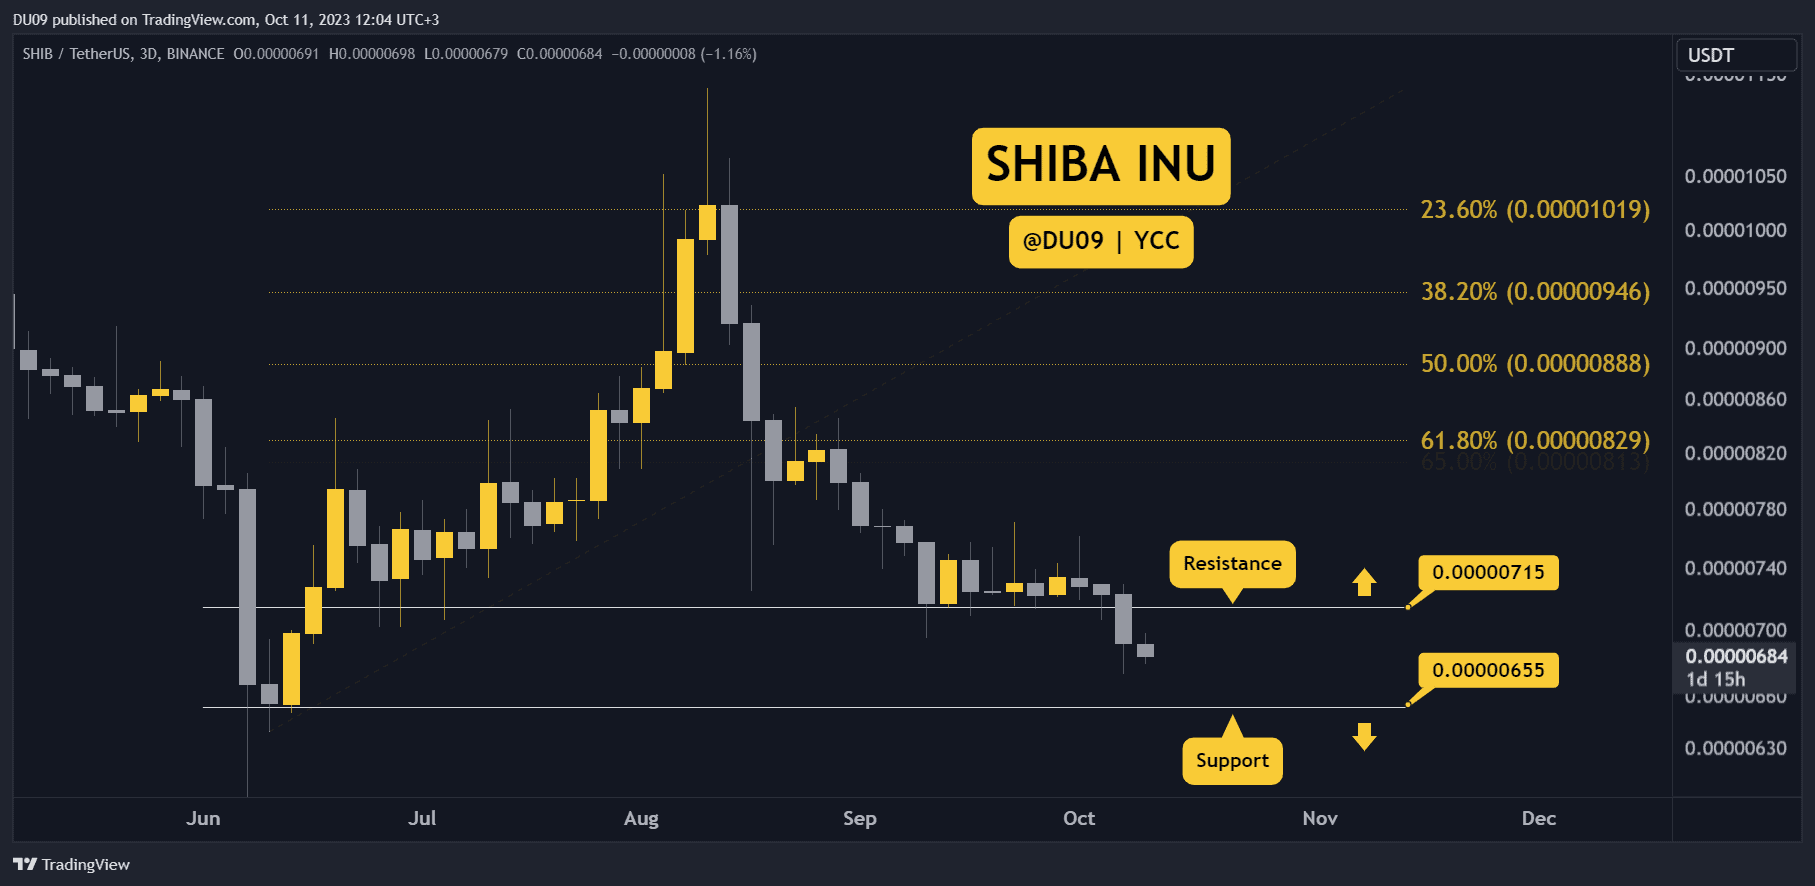
Shiba’s price broke below its previous support and is making lower lows.
Key Support levels: $0.0000065
Key Resistance levels: $0.0000071
1. Breakdown of Support
Unfortunately for bulls, the price took a nosedive as soon as the support at $0.0000071 was lost. Since then, this level has turned into a resistance, and buyers have retreated at $0.0000065, which will act as the next key support.
2. Bearish Price Actions
With new local lows, the price action is bearish, and a test of the support at $0.0000065 appears likely in this context. The momentum indicators also show weakness with no signs of a possible reversal at this time.
3. Sellers Dominate
The 3-day RSI has consistently remained under 50 points and has been making lower lows since August. So long as this trend continues, sellers will dominate the price action. Buyers might become interested as the RSI approaches 30 points.
Bias
The bias for SHIB is bearish.
Short-Term Prediction for SHIB Price
A test of the support at $0.0000065 appears inevitable if sellers continue to hold a tight grip on the price. It’s interesting to see how the price will perform over the coming week.
Binance Free $100 (Exclusive): Use this link to register and receive $100 free and 10% off fees on Binance Futures first month (terms).
PrimeXBT Special Offer: Use this link to register & enter CRYPTOPOTATO50 code to receive up to $7,000 on your deposits.
Disclaimer: Information found on CryptoPotato is those of writers quoted. It does not represent the opinions of CryptoPotato on whether to buy, sell, or hold any investments. You are advised to conduct your own research before making any investment decisions. Use provided information at your own risk. See Disclaimer for more information.
Cryptocurrency charts by TradingView.

