Several factors contribute to cancer rates, from personal habits and genetics to air pollution or groundwater quality in a given area. People experiencing social, economic, or environmental disadvantages are disproportionately affected by high cancer rates in certain regions—including access or barriers to early screening and care.
Cancer rates also fluctuate by jobs: Higher rates of cancer can be found among meat industry and rubber manufacturing workers, and farmers.
Stacker compiled the counties with the highest cancer rates in Missouri using data from the CDC. Keep reading to see where in your state cancer cases are the most common.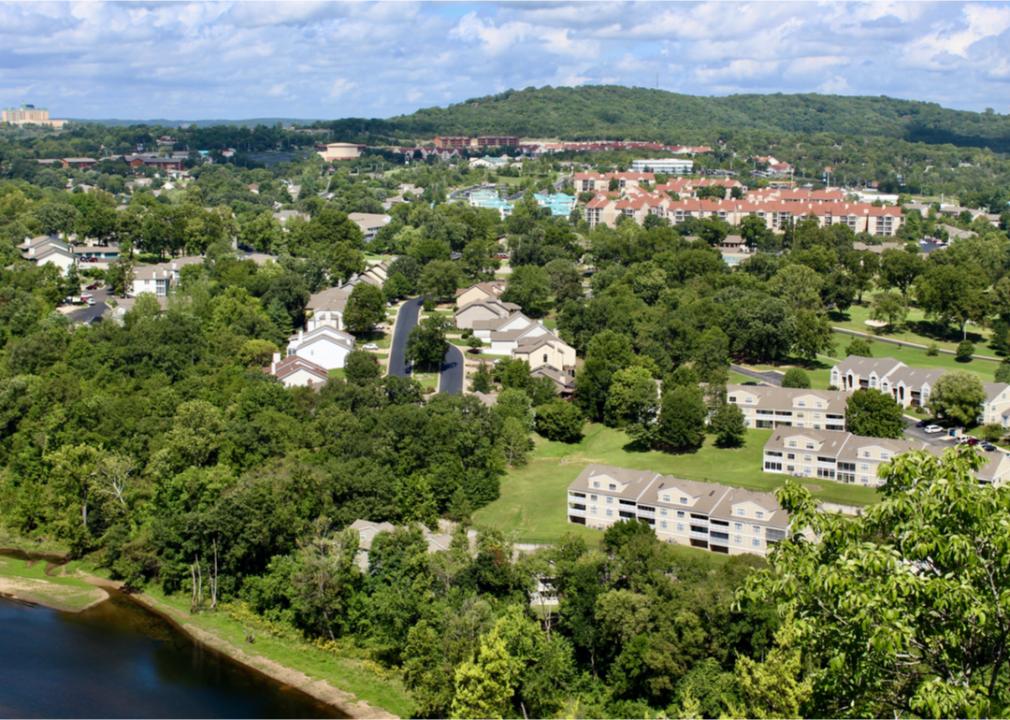
Lilith Munck // Shutterstock
#50. Taney County
– Cancer rate per 100,000, 2016-2020: 620.6
– Age-adjusted rate per 100,000, 2016-2020: 427.2
Canva
#49. Ralls County
– Cancer rate per 100,000, 2016-2020: 621.9
– Age-adjusted rate per 100,000, 2016-2020: 408.9
Canva
#48. Dent County
– Cancer rate per 100,000, 2016-2020: 622.5
– Age-adjusted rate per 100,000, 2016-2020: 423.2
Canva
#47. Barry County
– Cancer rate per 100,000, 2016-2020: 629.5
– Age-adjusted rate per 100,000, 2016-2020: 423.3
Wirestock Creators // Shutterstock
#46. Barton County
– Cancer rate per 100,000, 2016-2020: 630.7
– Age-adjusted rate per 100,000, 2016-2020: 451.1
Canva
#45. Bollinger County
– Cancer rate per 100,000, 2016-2020: 632.1
– Age-adjusted rate per 100,000, 2016-2020: 439.3
Rachael Martin // Shutterstock
#44. Lewis County
– Cancer rate per 100,000, 2016-2020: 636.5
– Age-adjusted rate per 100,000, 2016-2020: 492.6
Canva
#43. Atchison County
– Cancer rate per 100,000, 2016-2020: 637.1
– Age-adjusted rate per 100,000, 2016-2020: 405.9
Canva
#42. Wright County
– Cancer rate per 100,000, 2016-2020: 640.9
– Age-adjusted rate per 100,000, 2016-2020: 461.5
Canva
#41. Perry County
– Cancer rate per 100,000, 2016-2020: 641.8
– Age-adjusted rate per 100,000, 2016-2020: 468.6
Canva
#40. Andrew County
– Cancer rate per 100,000, 2016-2020: 642.6
– Age-adjusted rate per 100,000, 2016-2020: 469.0
Sabrina Janelle Gordon // Shutterstock
#39. Dunklin County
– Cancer rate per 100,000, 2016-2020: 645.4
– Age-adjusted rate per 100,000, 2016-2020: 493.1
Canva
#38. Dade County
– Cancer rate per 100,000, 2016-2020: 647.2
– Age-adjusted rate per 100,000, 2016-2020: 422.6
Canva
#37. Butler County
– Cancer rate per 100,000, 2016-2020: 647.9
– Age-adjusted rate per 100,000, 2016-2020: 481.2
karen_zelle_photography // Shutterstock
#36. Franklin County
– Cancer rate per 100,000, 2016-2020: 650.6
– Age-adjusted rate per 100,000, 2016-2020: 493.5
Canva
#35. St. Francois County
– Cancer rate per 100,000, 2016-2020: 654.1
– Age-adjusted rate per 100,000, 2016-2020: 523.4
Rachael Martin // Shutterstock
#34. Cedar County
– Cancer rate per 100,000, 2016-2020: 656.1
– Age-adjusted rate per 100,000, 2016-2020: 416.0
Photos BrianScantlebury // Shutterstock
#33. Marion County
– Cancer rate per 100,000, 2016-2020: 660.1
– Age-adjusted rate per 100,000, 2016-2020: 523.8
Patrick Jennings // Shutterstock
#32. Linn County
– Cancer rate per 100,000, 2016-2020: 663.1
– Age-adjusted rate per 100,000, 2016-2020: 443.9
Logan Bush // Shutterstock
#31. Dallas County
– Cancer rate per 100,000, 2016-2020: 663.9
– Age-adjusted rate per 100,000, 2016-2020: 462.4
Roberto Galan // Shutterstock
#30. Ste. Genevieve County
– Cancer rate per 100,000, 2016-2020: 669.8
– Age-adjusted rate per 100,000, 2016-2020: 468.9
Roberto Galan // Shutterstock
#29. Ripley County
– Cancer rate per 100,000, 2016-2020: 671.9
– Age-adjusted rate per 100,000, 2016-2020: 466.8
TommyBrison // Shutterstock
#28. St. Clair County
– Cancer rate per 100,000, 2016-2020: 672.7
– Age-adjusted rate per 100,000, 2016-2020: 397.8
Joseph Sohm // Shutterstock
#27. New Madrid County
– Cancer rate per 100,000, 2016-2020: 672.7
– Age-adjusted rate per 100,000, 2016-2020: 480.6
Canva
#26. Macon County
– Cancer rate per 100,000, 2016-2020: 673.1
– Age-adjusted rate per 100,000, 2016-2020: 463.7
Roberto Galan // Shutterstock
#25. Scott County
– Cancer rate per 100,000, 2016-2020: 674.7
– Age-adjusted rate per 100,000, 2016-2020: 515.2
Canva
#24. Harrison County
– Cancer rate per 100,000, 2016-2020: 676.4
– Age-adjusted rate per 100,000, 2016-2020: 458.0
HMBSoFL Photography // Shutterstock
#23. Henry County
– Cancer rate per 100,000, 2016-2020: 678.1
– Age-adjusted rate per 100,000, 2016-2020: 456.2
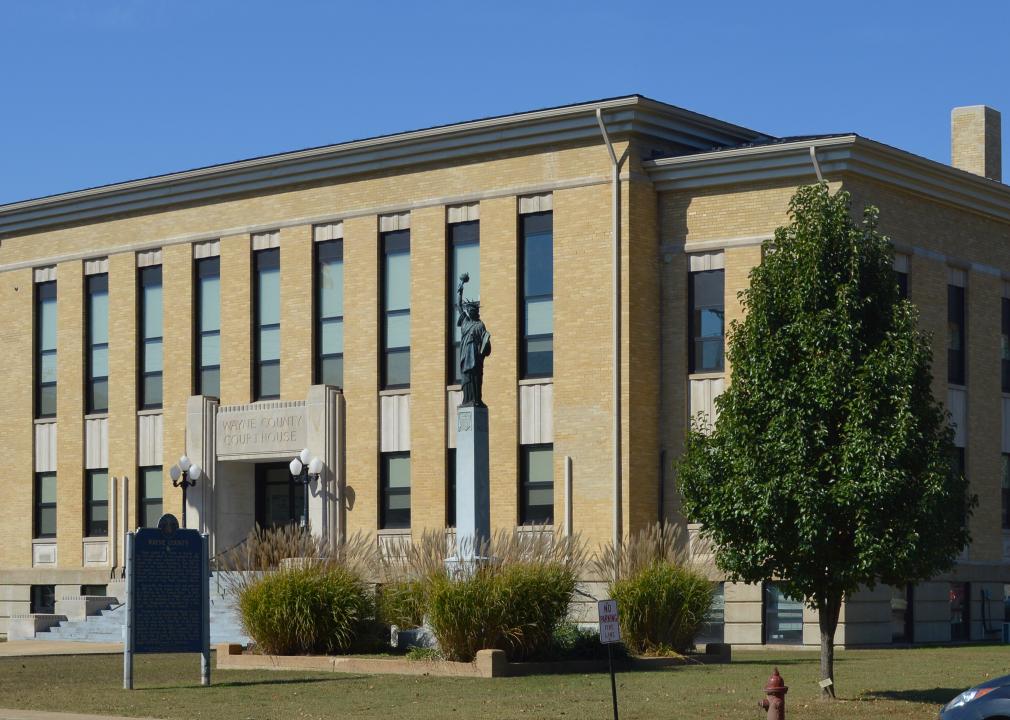
Canva
#22. Wayne County
– Cancer rate per 100,000, 2016-2020: 687.7
– Age-adjusted rate per 100,000, 2016-2020: 426.3
Canva
#21. Hickory County
– Cancer rate per 100,000, 2016-2020: 691.9
– Age-adjusted rate per 100,000, 2016-2020: 356.2
Canva
#20. Putnam County
– Cancer rate per 100,000, 2016-2020: 707.9
– Age-adjusted rate per 100,000, 2016-2020: 443.4
Canva
#19. Worth County
– Cancer rate per 100,000, 2016-2020: 709.8
– Age-adjusted rate per 100,000, 2016-2020: 452.7
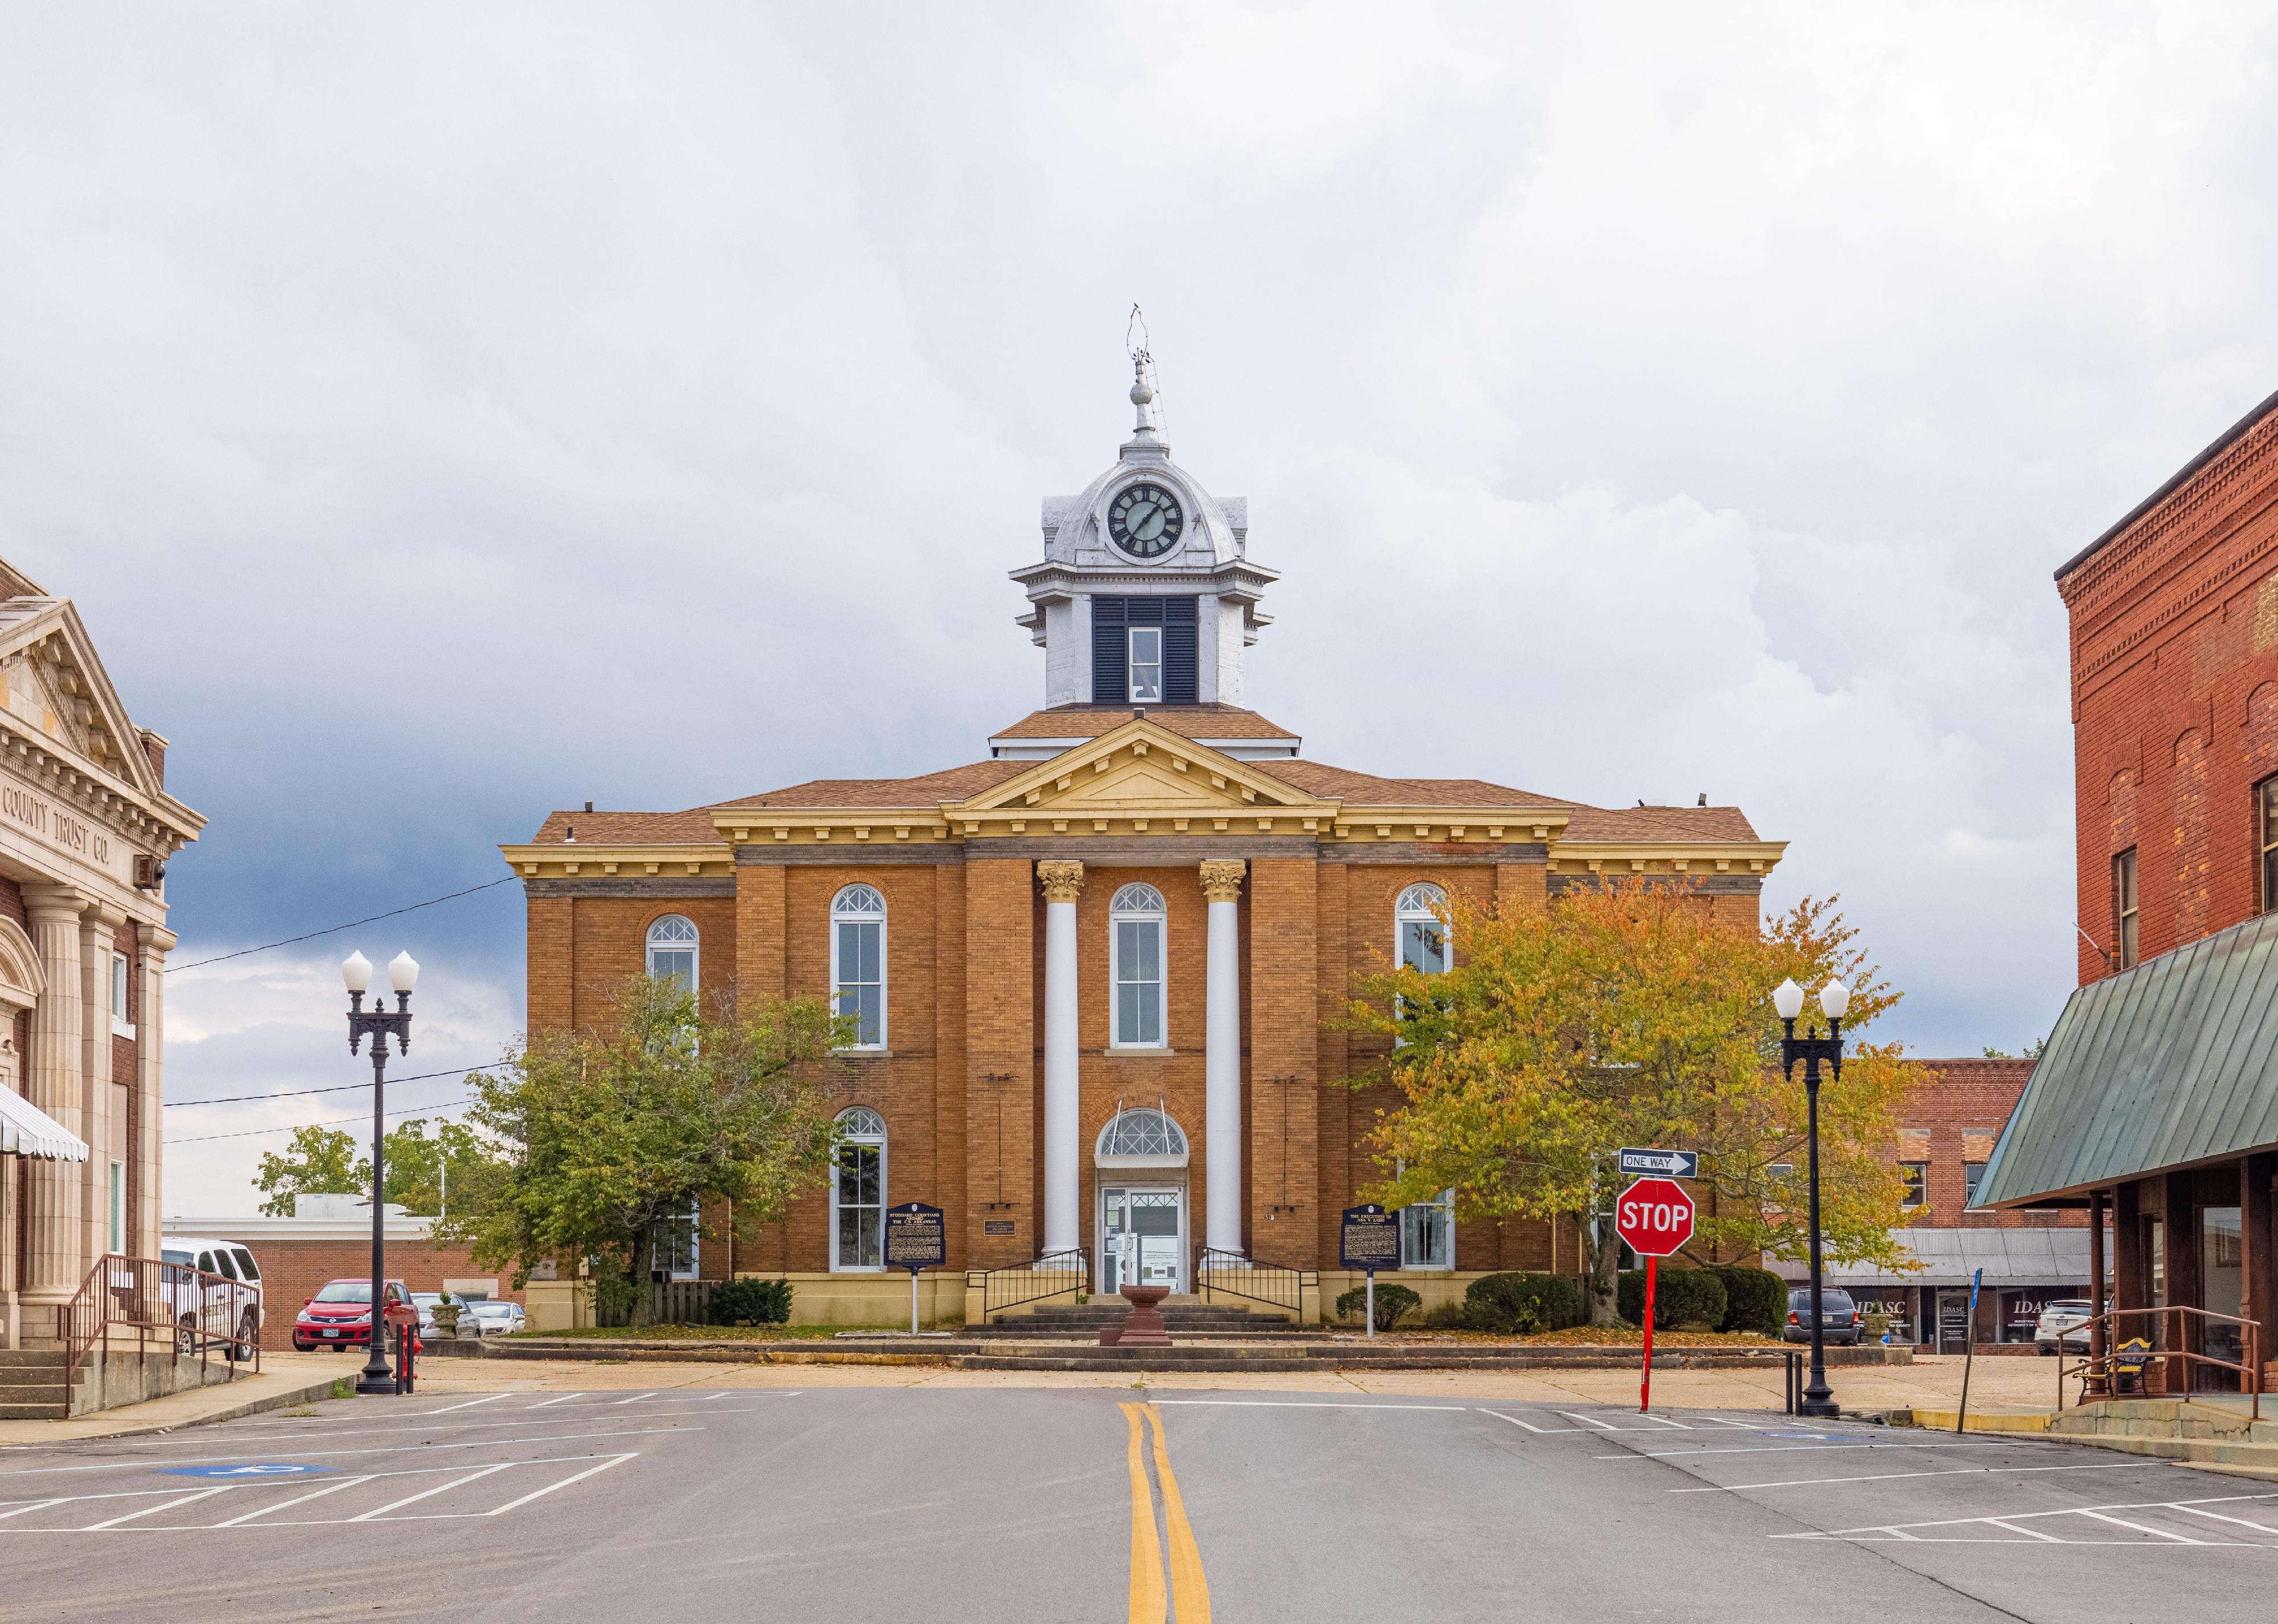
Roberto Galan // Shutterstock
#18. Stoddard County
– Cancer rate per 100,000, 2016-2020: 713.7
– Age-adjusted rate per 100,000, 2016-2020: 510.0
Scott Sanders // Shutterstock
#17. Reynolds County
– Cancer rate per 100,000, 2016-2020: 717.2
– Age-adjusted rate per 100,000, 2016-2020: 447.7
LanaG // Shutterstock
#16. Crawford County
– Cancer rate per 100,000, 2016-2020: 719.6
– Age-adjusted rate per 100,000, 2016-2020: 516.6
Canva
#15. Mississippi County
– Cancer rate per 100,000, 2016-2020: 727.8
– Age-adjusted rate per 100,000, 2016-2020: 545.7
Canva
#14. Shelby County
– Cancer rate per 100,000, 2016-2020: 733.1
– Age-adjusted rate per 100,000, 2016-2020: 510.7
Canva
#13. Morgan County
– Cancer rate per 100,000, 2016-2020: 733.9
– Age-adjusted rate per 100,000, 2016-2020: 471.8
Canva
#12. Holt County
– Cancer rate per 100,000, 2016-2020: 736.1
– Age-adjusted rate per 100,000, 2016-2020: 451.6
Canva
#11. Madison County
– Cancer rate per 100,000, 2016-2020: 742.4
– Age-adjusted rate per 100,000, 2016-2020: 531.0
Canva
#10. Monroe County
– Cancer rate per 100,000, 2016-2020: 746.2
– Age-adjusted rate per 100,000, 2016-2020: 475.8
Lisa Fitzthum Photography // Shutterstock
#9. Camden County
– Cancer rate per 100,000, 2016-2020: 749.8
– Age-adjusted rate per 100,000, 2016-2020: 405.5
Canva
#8. Mercer County
– Cancer rate per 100,000, 2016-2020: 750.8
– Age-adjusted rate per 100,000, 2016-2020: 492.9
Chrysa Rene Snow // Shutterstock
#7. Gasconade County
– Cancer rate per 100,000, 2016-2020: 757.9
– Age-adjusted rate per 100,000, 2016-2020: 477.9
Canva
#6. Iron County
– Cancer rate per 100,000, 2016-2020: 764.6
– Age-adjusted rate per 100,000, 2016-2020: 504.8
Canva
#5. Stone County
– Cancer rate per 100,000, 2016-2020: 769.3
– Age-adjusted rate per 100,000, 2016-2020: 398.8
Zack Frank // Shutterstock
#4. Ozark County
– Cancer rate per 100,000, 2016-2020: 770.4
– Age-adjusted rate per 100,000, 2016-2020: 423.0
Canva
#3. Chariton County
– Cancer rate per 100,000, 2016-2020: 775.9
– Age-adjusted rate per 100,000, 2016-2020: 490.5
Canva
#2. Montgomery County
– Cancer rate per 100,000, 2016-2020: 792.0
– Age-adjusted rate per 100,000, 2016-2020: 557.1
TommyBrison // Shutterstock
#1. Benton County
– Cancer rate per 100,000, 2016-2020: 880.6
– Age-adjusted rate per 100,000, 2016-2020: 455.9


