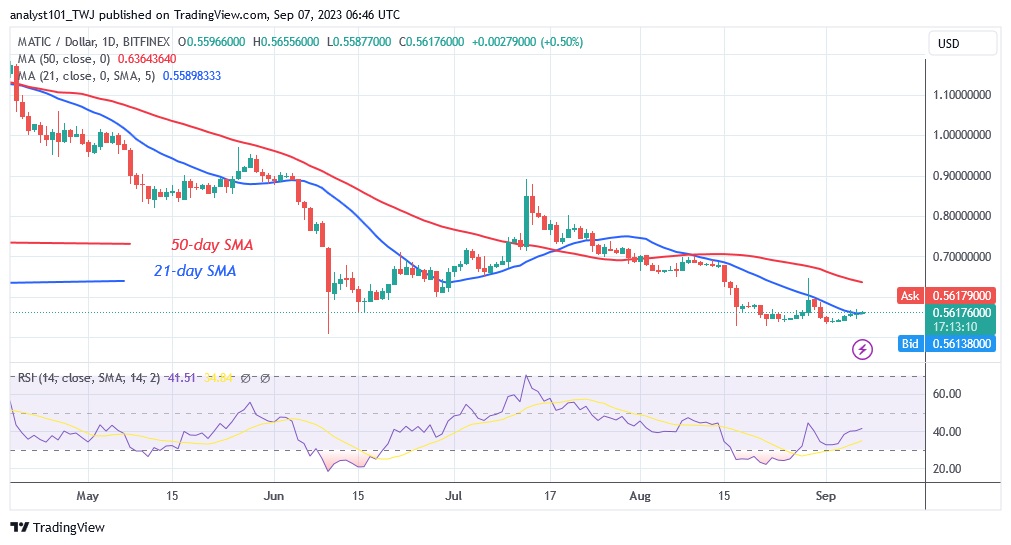
Cryptocurrency analysts of Coinidol.com report, Polygon (MATIC) price has been trending sideways since the June 10 decline.
Long-term forecast of the Polygon price: fluctuation range
The downtrend has ended above the $0.50 support since June 10. At the time this article was written, the market had risen to a low of $0.56. However, at the end of a downtrend, the bulls bought the dips and the price reached a high of $0.89.
In other words, the price of the altcoin moved in a range between $0.50 and $0.90. If the price falls below the current support of $0.50, the downtrend will continue. The resistance at $0.65 and the 21-day line SMA currently limit the upward movement.
Polygon indicator analysis
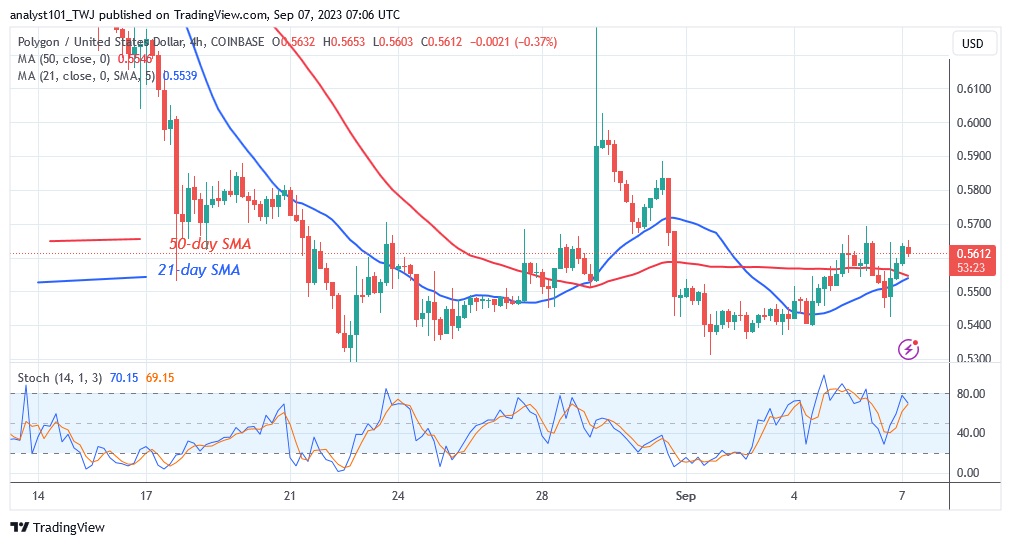
Polygon has fallen to the Relative Strength Index of period 14, level 41. As it retests the existing support, altcoin is in a downtrend. The price bars have now fallen below the moving average lines, indicating a likely decline. The bullish momentum has peaked above the daily stochastic threshold of 75. The cryptocurrency value could fall into the overbought zone of the market.

Technical indicators
Resistance levels: $1.20, $1.30, $1.40
Support levels: $0.60, $0.40, $0.30
What is the next move for Polygon?
Polygon continues to trade sideways, returning to the $0.50 price range. The trend in the range will continue if the altcoin reverses its price and holds above the current support. Currently, the altcoin is declining and trading below the 21-day line SMA. Another rejection of the 21-day line SMA will lead to a decline.

As we reported on August 31, the upward momentum was rejected on August 29 at a high of $0.65. The altcoin has fallen below the support level of $0.60.
Disclaimer. This analysis and forecast are the personal opinions of the author and are not a recommendation to buy or sell cryptocurrency and should not be viewed as an endorsement by CoinIdol.com. Readers should do their research before investing in funds.


