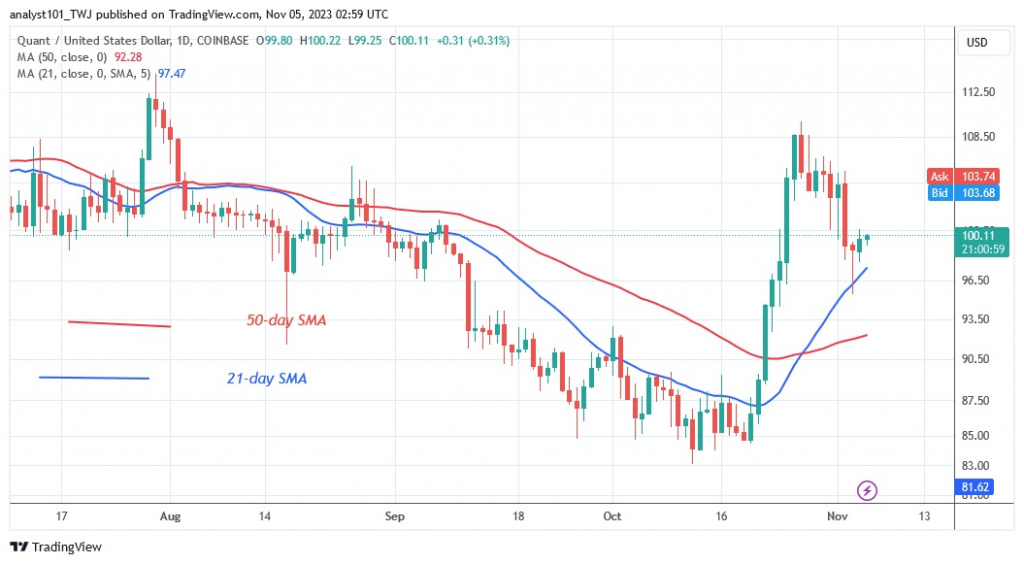
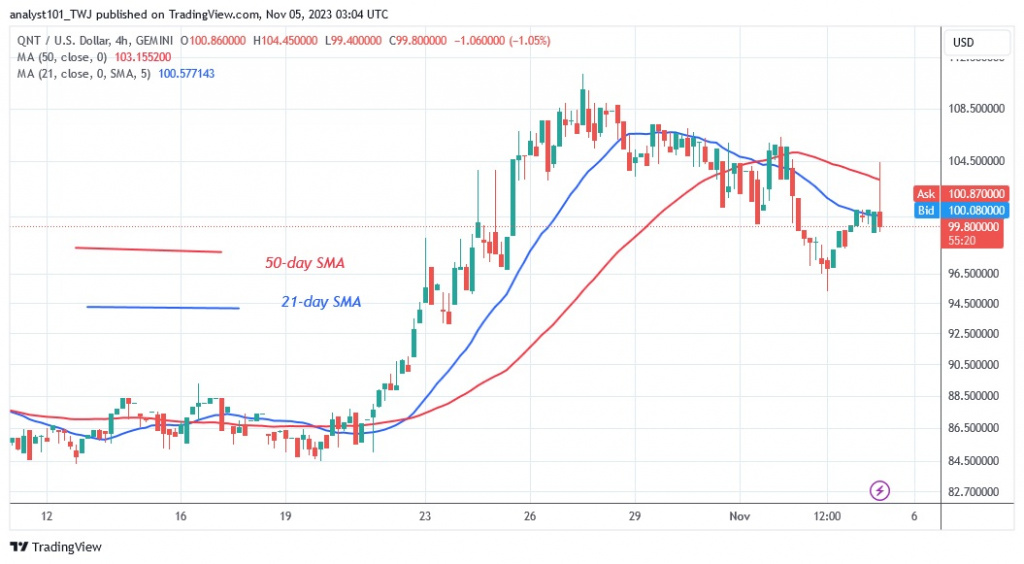
The price of Quant (QNT) has retreated and found support above the moving average lines. This is a continuation of the uptrend that was broken on October 26 at a high of $110.
Quant long term price forecast: bullish
The cryptocurrency is reversing its previous downtrend. The altcoin’s rise has continued above the moving average lines. Quant will rise if the altcoin finds support above the moving average lines. A break of the resistance at $110 will see QNT rise to a high of $126. Conversely, the altcoin will remain in its range between $96 and $110, negating the significance of the bullish scenario. At the time of writing, QNT/USD is trading at $100.26.
Quant price indicator analysis
QNT resumes its uptrend as the price retraces above the moving average lines. This indicates a further rise in the cryptocurrency. If the bears had broken below the moving average lines, the downtrend would have continued. Despite the decline, the moving average lines remain at a positive crossover. The 21-day simple moving average has held above the 50-day simple moving average.

Technical indicators
Key supply zones: $140, $150, $160
Key demand zones: $90, $80, $70
What is the next move for Quant?
QNT/USD is still rallying as it pulls back above the moving average lines. Since October 26, the altcoin’s price has been fluctuating between $96 and $110, indicating a potential move higher. As buyers rally, the cryptocurrency has found support above the moving average lines. If the buyers manage to hold the support level of $96, the uptrend will continue.

As we reported on October 28, the positive momentum continued to the high of $108 before being stopped at the $110 barrier zone. The recent high on October 26 stopped the uptrend.
Disclaimer. This analysis and forecast are the personal opinions of the author and are not a recommendation to buy or sell cryptocurrency and should not be viewed as an endorsement by CoinIdol.com. Readers should do their research before investing in funds.


