Cryptocurrency analysts of Coinidol.com report, the Quant (QNT) price is moving sideways, but has regained an upward momentum.
Quant long-term price forecast: in range
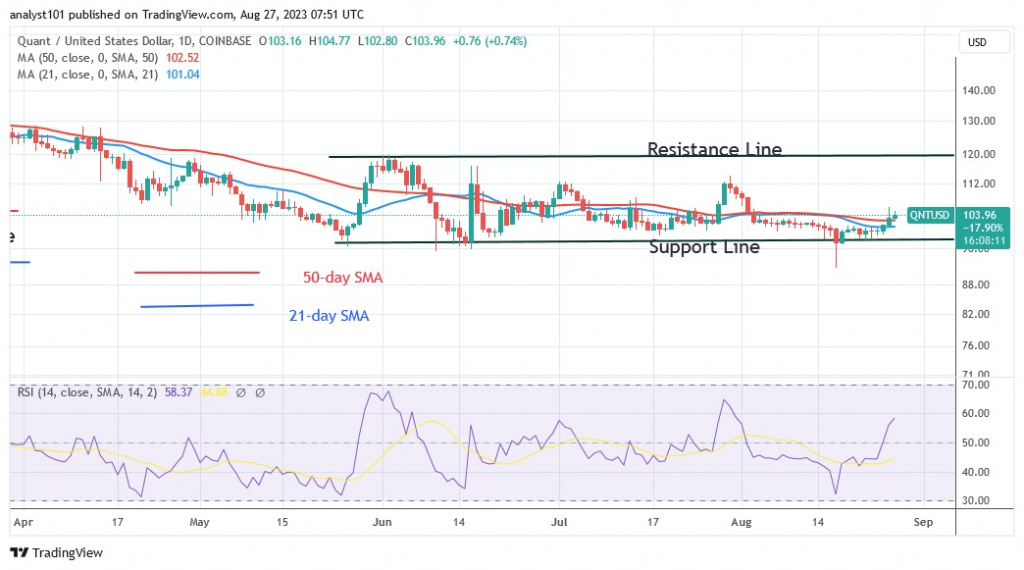
The cryptocurrency has broken through the moving average lines and resumed its uptrend. The price indicator predicts that QNT will rise to a high of $109.
The cryptocurrency is likely to face resistance at $115 and $120. Since May 30, the upside has been at previous highs. At the time of writing, QNT is trading at $104. On the positive side, the current rise will continue if the price stays above the moving average lines. If buyers break the barrier at $120, QNT will resume its uptrend.
Quant price indicator analysis
The crypto asset is gaining value as it reaches the Relative Strength Index of 58 for the period 14. The altcoin is in an uptrend and could continue to rise. The price bars are currently above the moving average lines, suggesting that the cryptocurrency could be on the rise. The uptrend of the altcoin has continued. It is above the daily stochastic value of 60.

Technical Indicators
Key supply zones: $140, $150, $160
Key demand zones: $90, $80, $70
What is the next step for Quant?
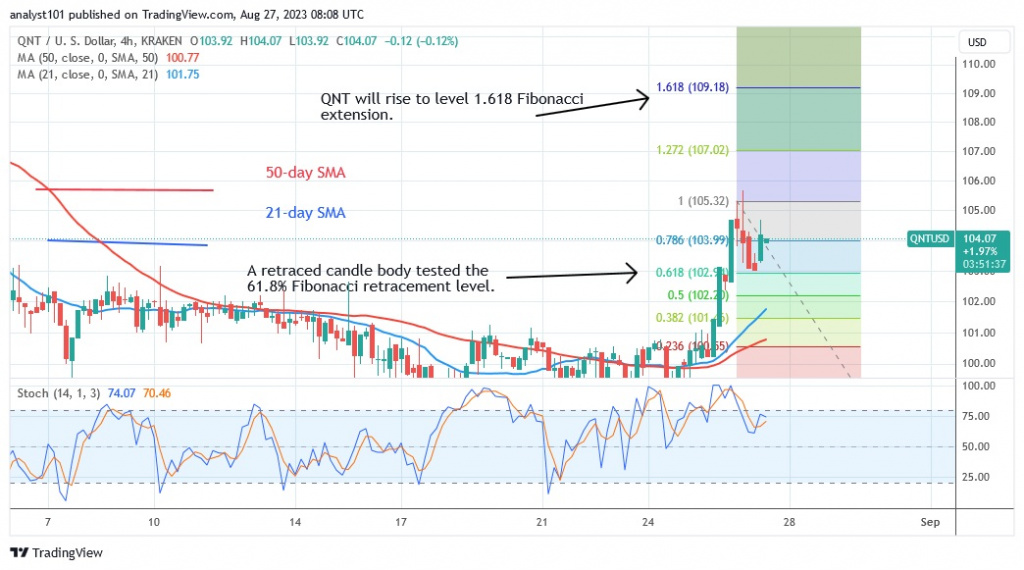
The uptrend of QNT has continued as the price has risen above the moving average lines. The uptrend is encountering initial resistance at a high of $105. A retraced candlestick of the August 26 upswing tested the 61.8% Fibonacci retracement level. The retracement indicates that QNT will rise to the Fibonacci extension of 1.618, or $109.18.

As we reported on August 20, the cryptocurrency price has returned to the range-bound zone. The altcoin returns to the price range of $95 to $120.
Disclaimer. This analysis and forecast are the personal opinions of the author and are not a recommendation to buy or sell cryptocurrency and should not be viewed as an endorsement by CoinIdol.com. Readers should do their research before investing in funds.


