The price of the Ripple (XRP) coin is now falling after a strong rejection at recent highs. Price analysis by Coinidol.com.
Long-term forecast for the Ripple price: bearish
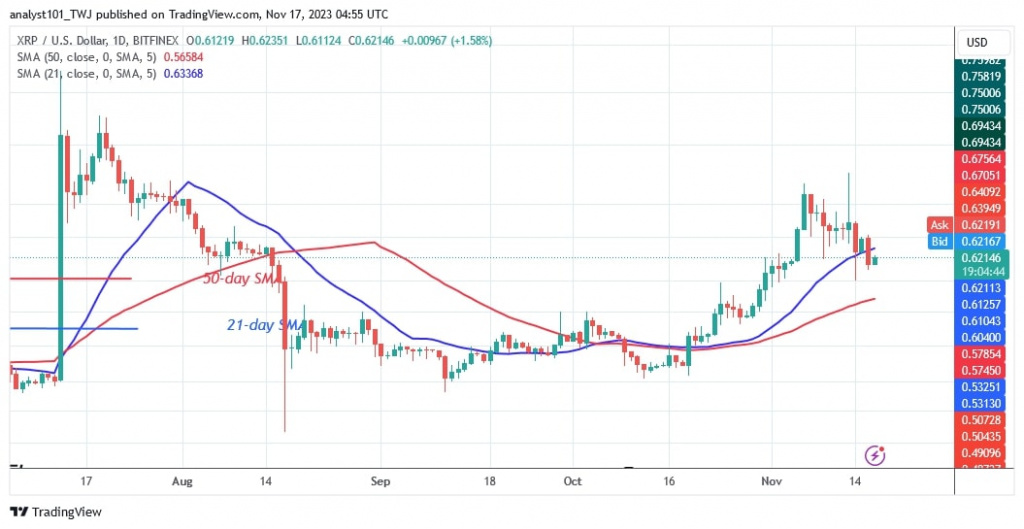
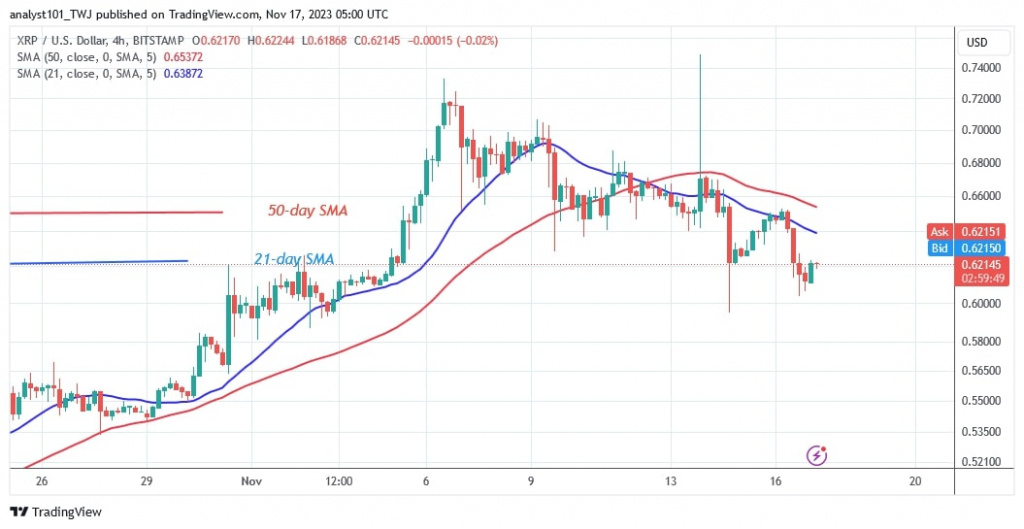
Ripple has been rejected twice at the resistance levels of $0.74 and $0.75. On November 13, the extended candlestick tail is a sign of significant selling pressure at high price levels.
The cryptocurrency price plunged sharply above the $0.64 support and continued its negative trend below the 21-day SMA. The bears have successfully broken below the 21-day simple moving average. If the negative trend continues, the altcoin will fall to the lows above the 50-day SMA. In other words, XRP is at risk of a further decline to a low of $0.56. Nonetheless, XRP/USD is worth $0.62 at the time of writing.
XRP indicator analysis
The cryptocurrency is currently trading between the moving average lines. The boundary between the moving average lines will be temporary for a few days. The altcoin will fall to the lower moving average line, which is the 50-day simple moving average. When the 50-day SMA is breached, the decline will begin. The current price fluctuations will continue as long as the price remains above the 50-day SMA.
Technical indicators:
Key resistance levels – $0.80 and $1.00
Key support levels – $0.40 and $0.20

What is the next move for XRP?
XRP is losing value. The current decline could extend to a low above $0.56. The altcoin will be in the previous range bound zone, which was between $0.45 and $0.55, if the bearish momentum continues. However, if the support at $0.56 holds, the uptrend will resume.
 On November 10, the uptrend for Ripple coin ended as buyers failed to sustain the positive momentum above the $0.74 mark, as reported by Coinidol.com.
Disclaimer. This analysis and forecast are the personal opinions of the author and are not a recommendation to buy or sell cryptocurrency and should not be viewed as an endorsement by CoinIdol.com. Readers should do their research before investing in funds.


