- ADA price is trading in a bearish zone below the $0.50 support zone against the US Dollar.
- The price is now trading below $0.50 and the 55 simple moving average (4 hours).
- There is a connecting bearish trend line forming with resistance near $0.460 on the 4-hour chart (data feed via Coinbase).
- The price could continue to move down if it stays below the $0.50 resistance zone.
Cardano price is struggling below $0.50 against the US Dollar, like Bitcoin. ADA price could start a fresh increase if it clears the $0.480 and $0.500 resistance levels.
Cardano Price (ADA) Analysis
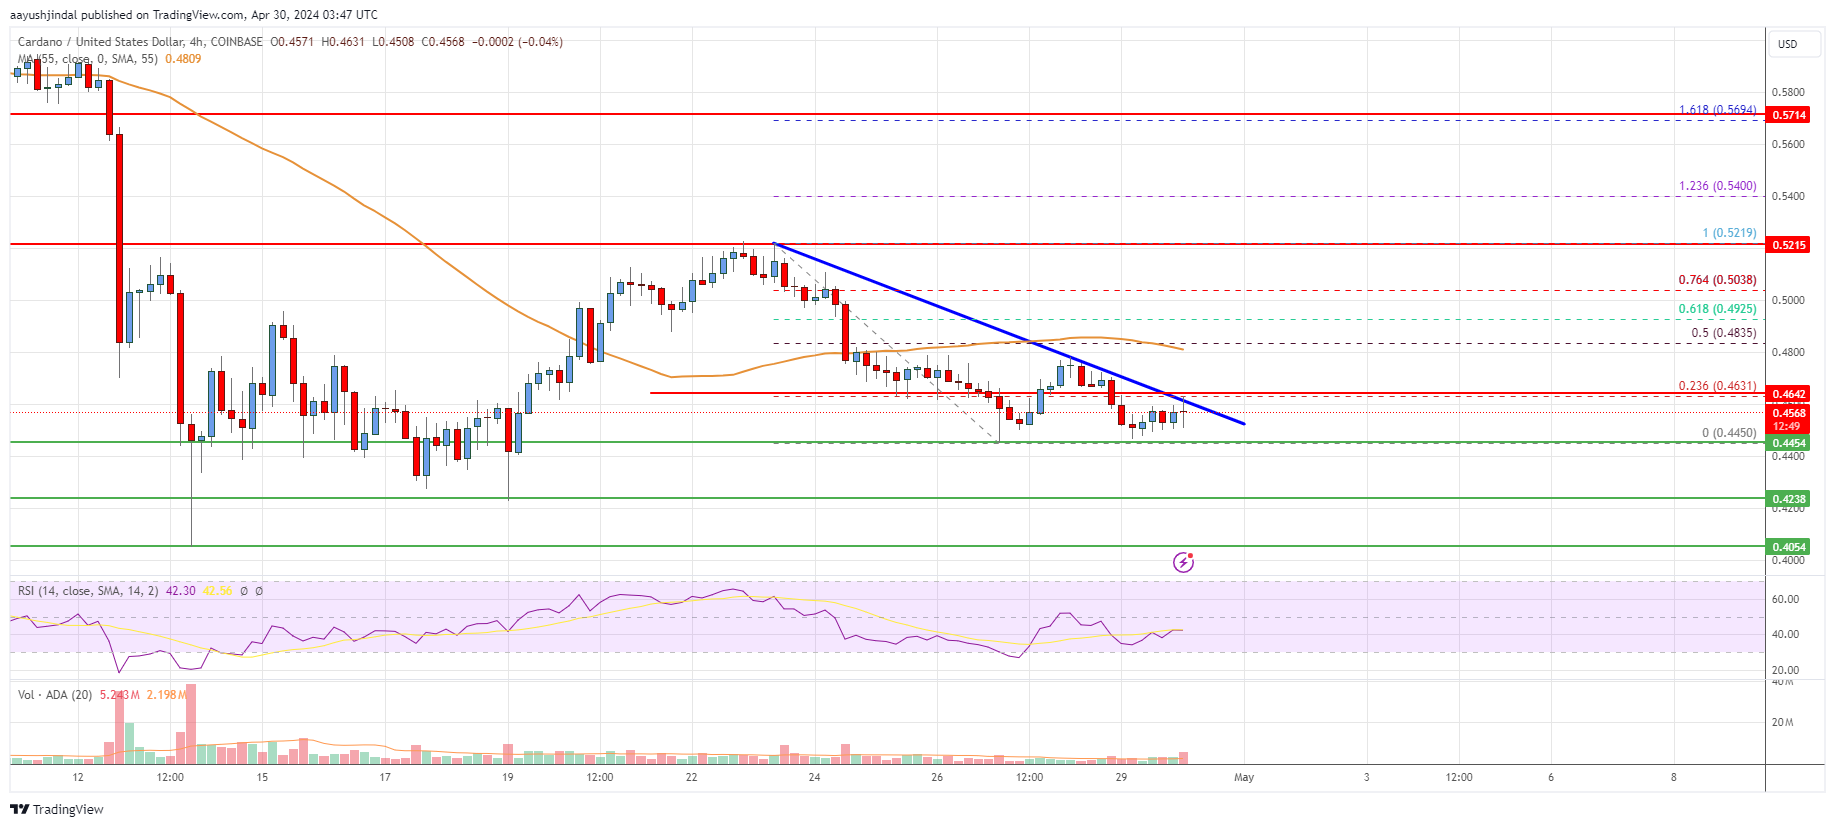
In the past few days, Cardano price started a fresh decline from the $0.5220 resistance against the US Dollar. The ADA/USD pair declined below the $0.500 and $0.480 support levels.
The price even declined below the $0.4650 support and the 55 simple moving average (4 hours). It revisited the $0.4450 support zone. A low has formed near $0.4450 and the price is now consolidating losses. There was a minor increase toward the 23.6% Fib retracement level of the recent decline from the $0.5219 swing high to the $0.4450 low.
On the upside, immediate resistance is near the $0.460 zone. There is also a connecting bearish trend line forming with resistance near $0.460 on the 4-hour chart.
The first major resistance is near the $0.4840 level or the 55 simple moving average (4 hours) or the 50% Fib retracement level of the recent decline from the $0.5219 swing high to the $0.4450 low. The next key resistance could be $0.50.
A clear upside break above the $0.50 level might send the price toward the $0.550 resistance. Any more gains could start a steady increase toward the $0.600 level or even $0.6250.
On the downside, immediate support is near the $0.4450 level. The next major support is near the $0.4250 level, below which the price may perhaps decline toward the $0.4050 support level. Any more losses might call for a test of the $0.380 level.
The chart indicates that ADA price is now trading below $0.50 and the 55 simple moving average (4 hours). Overall, the price could continue to move down if it stays below the $0.50 resistance zone.
Technical Indicators
4 hours MACD – The MACD for ADA/USD is now losing pace in the bearish zone.
4 hours RSI – The RSI for ADA/USD is now below the 50 level.
Key Support Levels – $0.4450 and $0.4250.
Key Resistance Levels – $0.4600 and $0.5000.